Hospitals are about to face the twin hurricanes of flu and COVID-19. The former follows a predictable pattern every year; the latter has been virtually unforeseeable. In response to these challenges, Array Advisors has performed a pattern analysis to demonstrate the different nature of the hospitalization patterns for flu and COVID-19. Paired with the analysis, the consulting team released a winter surge resilience guide for health systems.

As we move into the fall and winter seasons, health systems must not only plan for the annual increase of influenza-related admissions, but also the increase in COVID-19 hospitalizations. Our analysis shows that hospitals will need to spend considerable resources on building radical flexibility into their systems or risk being overrun.
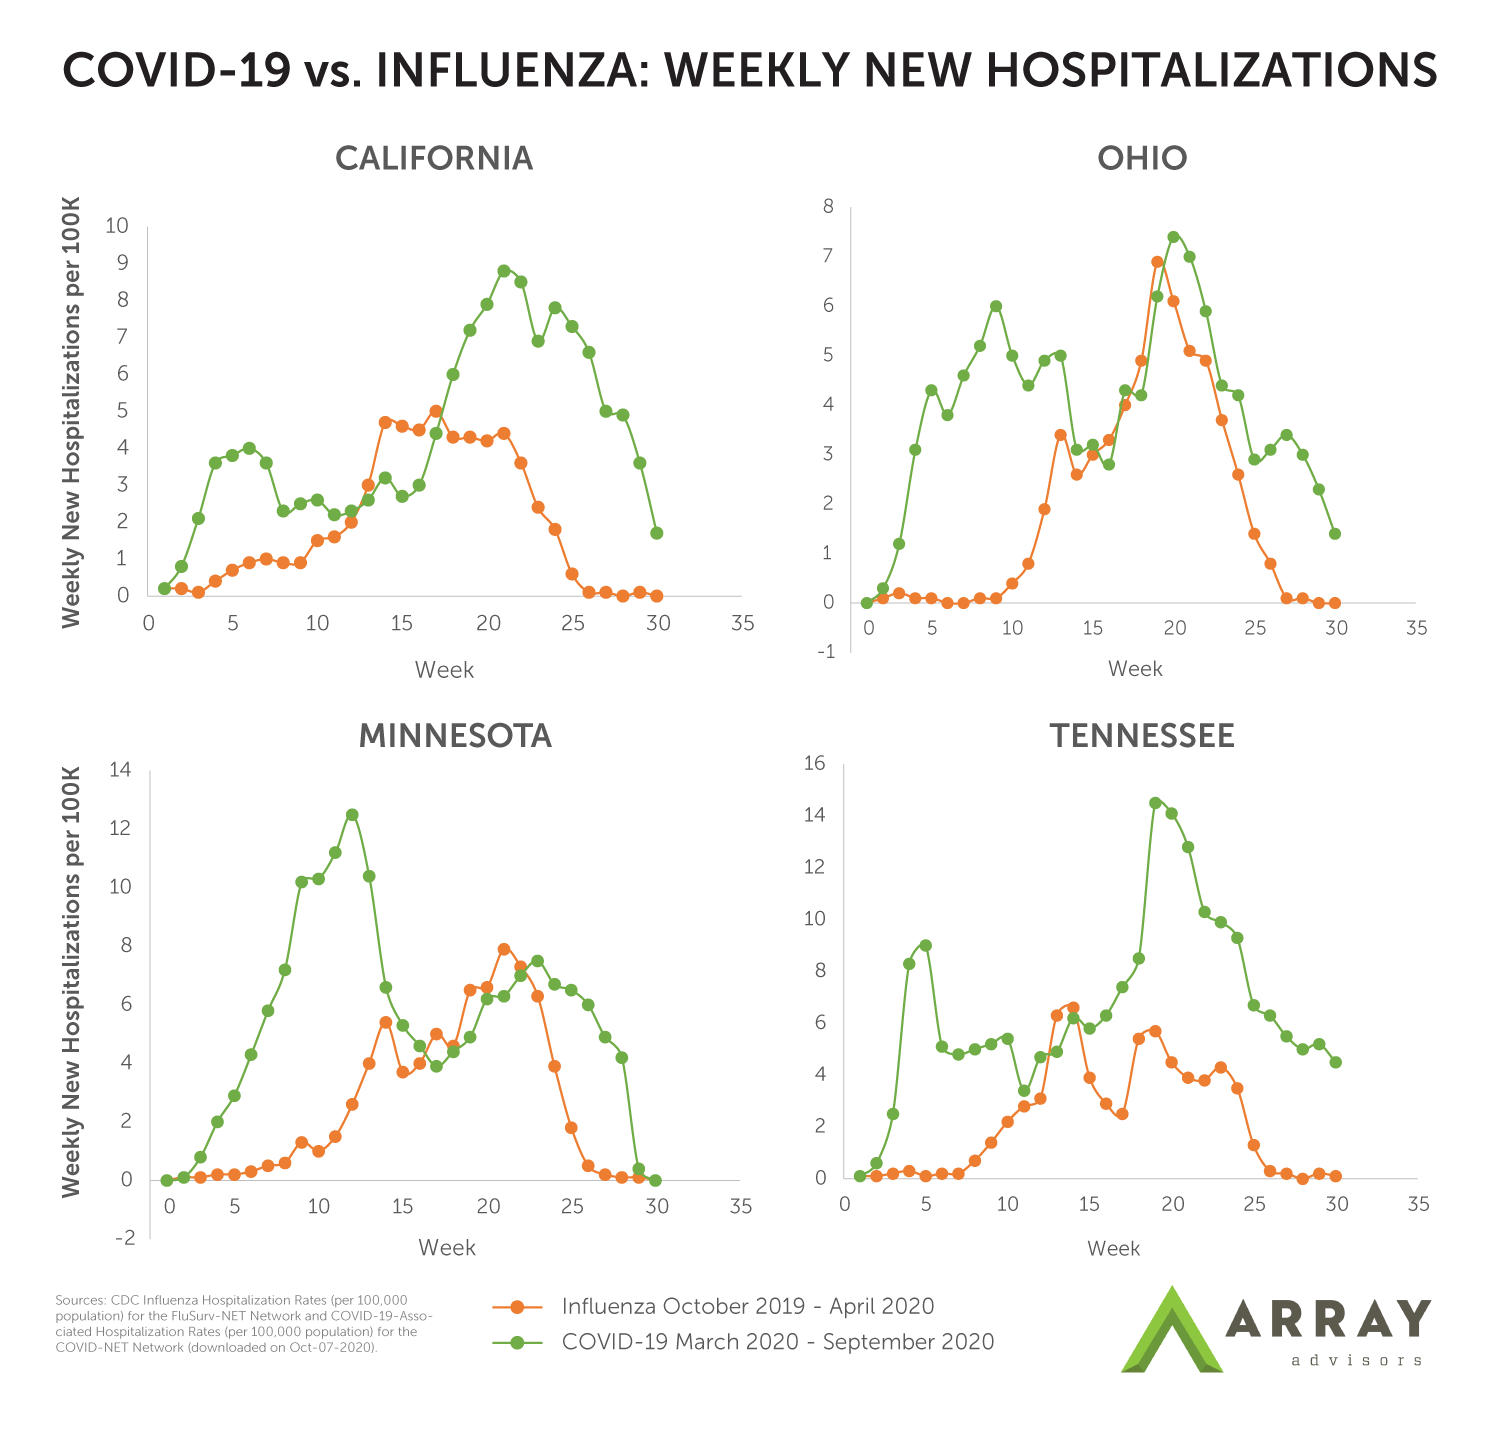
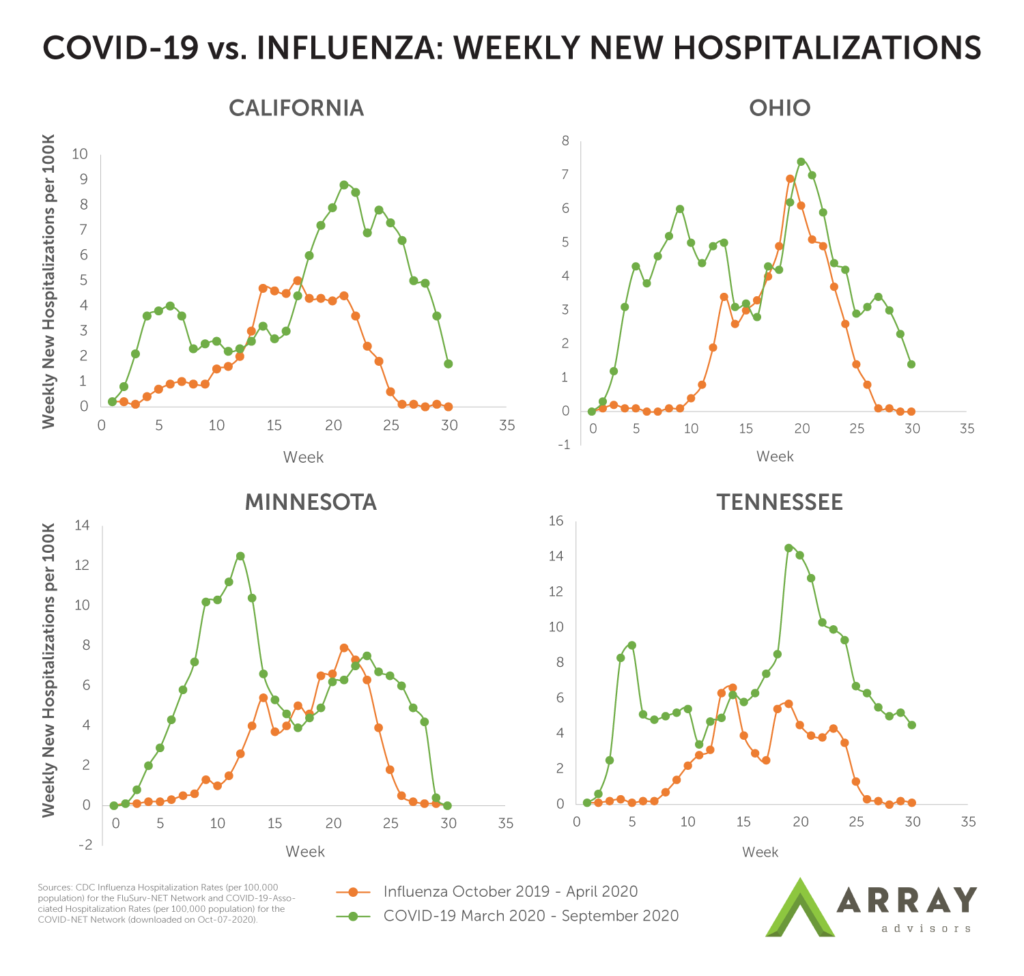
To illustrate the different nature of the hospitalization patterns for flu and COVID- 19, Array Advisors has overlayed the weekly hospitalizations rate per 100,000 during the first 30 weeks of the most recent flu season (2019-2020) with the most recent 30 weeks of the COVID-19 pandemic for a sample of four states. In each, it is possible to see how the flu admissions ramp up to a peak, then gradually decline. Meanwhile, COVID-19 has not only experienced at least two peaks in each of these states, there have also been sudden drops and rises from week to week. This is particularly evident in the California, Iowa, and Tennessee examples. Across these examples, the standard deviation of the COVID-19 weekly hospitalization rate is 1.3 to 2.9X higher than the weekly hospitalization rate for the flu2.
With flu, we know there are “bad” and “good” flu seasons. In the last 10 seasons alone, we have experienced seasons with as few as 140,000 hospitalizations in the 2011-2012 season and as high as 810,000 in the 2017-2018 season1.
While the magnitude of hospitalizations varies, the rise and fall each season is largely predictable and similar across the country. By Christmas, hospitals largely know what is coming, and the peak consistently comes and goes in about 12 weeks. What is predictable can be staffed and managed. Additional units can be staffed and kept open and busy for weeks. In the grand scheme of things, even in a bad flu year, flu-related hospitalizations make up no more than two percent of overall annual hospitalizations2.
COVID-19, on the other hand, is not predictable due to variations in human behavioral patterns (e.g. mobility: people following orders to stay home vs. people getting tired and going out) and differences in the nature of how the disease spreads (e.g. super spreader events and super spreader individuals). Data suggests that while coastal states (NY, NJ, CA, and others) saw large drops in mobility at the start of the pandemic, that was less the case in southern states, including Texas, Alabama and Arizona3. Paired with the fact that research indicates only 10-20 percent of those who test positive are responsible for 80 percent of the coronavirus’ spread,4 it’s no surprise that some hospitals in states like Texas and Arizona were overwhelmed late in the first wave, while makeshift hospitals that were set up in anticipation of a shortage in the Northeast (such as in NYC, Baltimore) were barely used.
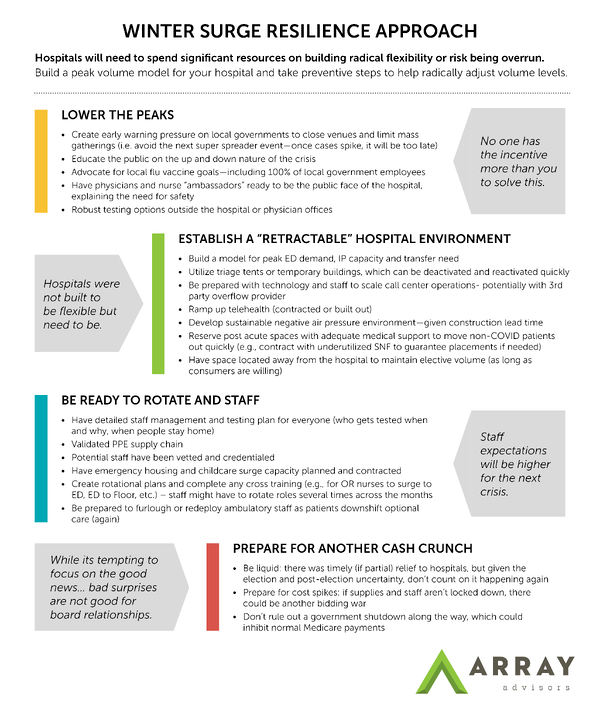
While there is hope that this year will be a “good” or even “great” flu season, if COVID-19 hospitalizations continue to swing as they have, and if super spreader events cause sudden peaks at a more local level, hospitals must be prepared to flex staff and manage capacity for triage and admission. Hospitals will need to stay nimble, ready to staff up and down along with the expected variation, but also prepared to rapidly increase capacity should the peak in flu admissions coincide with a peak in COVID admissions.
Refine your winter surge resilience approach by reading our guide below (click to enlarge).
For more COVID-19 tools, visit our resource hub.


